GPU
From 321 s to 37 s: a whole F1 CFD job on the GPU
The solver was already on the GPU. Most of the job's time was not. We profiled an F1 run on six NVIDIA GPUs, moved post-processing, geometry and rendering onto the device, and got 8.7× on an H100.
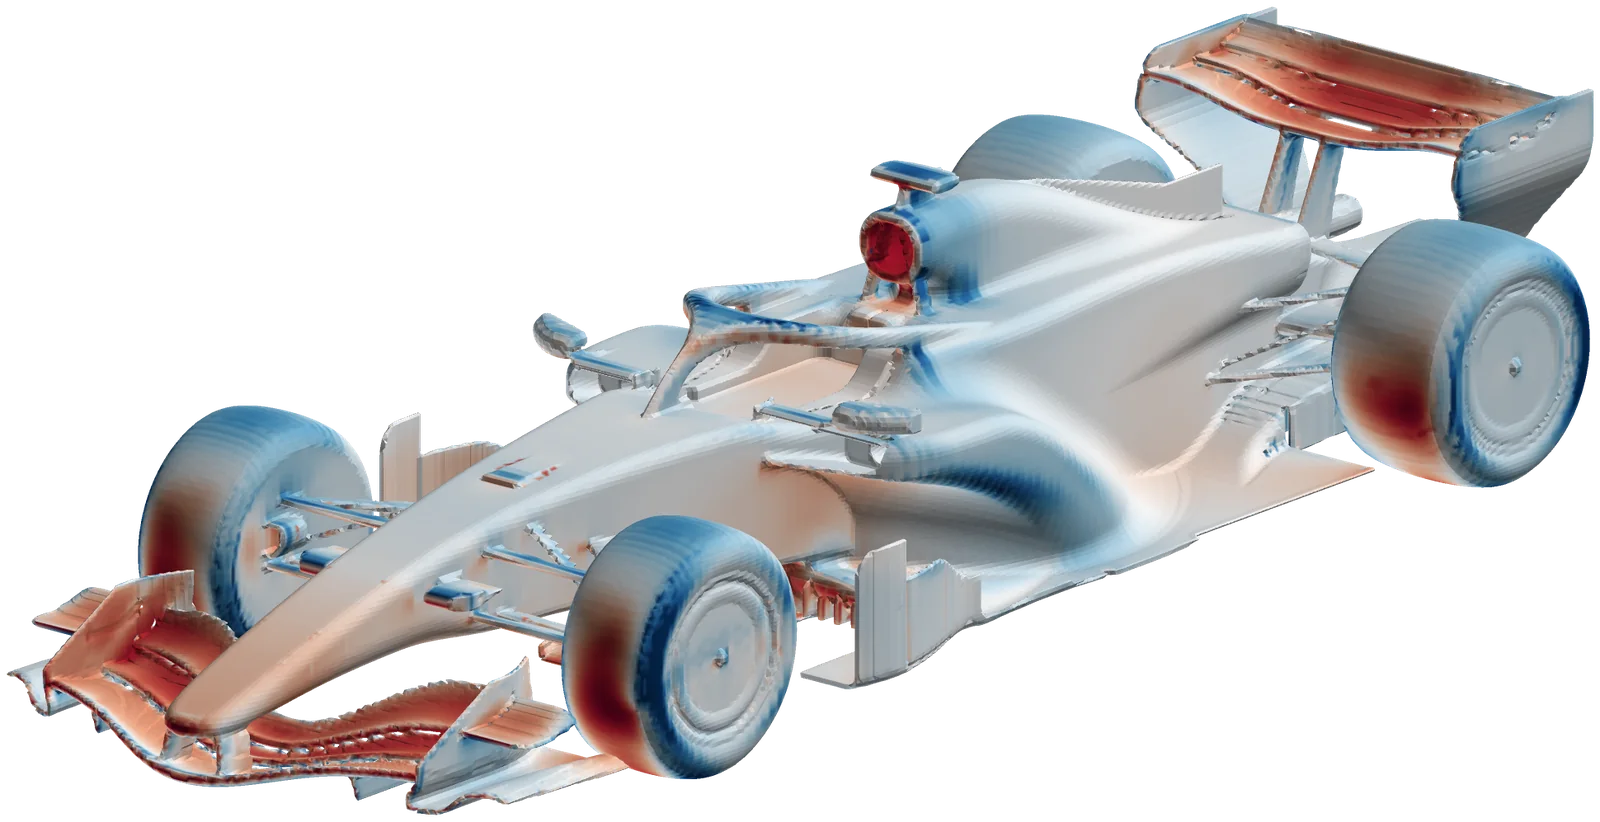
LeonSim’s aerodynamics solver has run on the GPU since version 5: steady RANS with k-ω SST, cut-cell Cartesian grids, SIMPLE with a multigrid-preconditioned conjugate gradient for the pressure, all as WGSL compute kernels through wgpu. It runs on Metal, Vulkan and DX12, so the same code drives an Apple laptop, an AMD integrated GPU and a data-centre NVIDIA card.
Until this week we had never run it on an NVIDIA GPU. When we did, on six of them through Modal (T4, L4, A10G, L40S, A100 80GB and H100), a fast GPU barely helped. An H100 finished the F1 medium job (2.5 M cells, settle-then-average, full report) in 321 s. The mini PC’s Radeon 680M, an integrated GPU, took 390 s.
Where the time went
A cProfile of the drive loop on the H100 gave the answer. The GPU iterations were about 15 s of every 1000. The rest was host work that had been cheap next to a slow GPU and dominated next to a fast one:
| F1 medium on an H100, per 1000 iterations (before) | time |
|---|---|
| Checkpoints: every field downloaded every 100 iterations, converted to float64 and written with single-threaded zlib | ~100 s |
| Force records: six fields (80 MB) downloaded every 10 iterations, integrated on the CPU in float64 | ~41 s |
| Averaging window: four fields downloaded and accumulated every 5 iterations | ~6 s |
| The GPU iterations themselves | ~15 s |
We had first guessed from per-cell speeds that “about 90 % is host work”. The share was right, but the biggest single item was compressed checkpoints, which we had not suspected. Measure before you move things.
Step 1: the drive loop stays on the device
- Forces. A
wall_forcekernel computes the pressure and wall-function shear force of every wall cell. A force record now downloads 6 floats per wall cell instead of six full fields; the per-component sums, moments and balance stay in float64 on the host. - Means. A
field_meankernel keeps running means of U, p, k and νt on the device. They come back once, at the end. - Checkpoints are written at most every 300 s, uncompressed, in float32 (the GPU’s own precision).
A test (S27.5) runs both paths on every GPU: forces, component split and balance agree to 1.3e-7, means to 1.0e-7. Per iteration, the H100 went from 152.5 ms to 14.9 ms, now 64× the 16-thread CPU (958 ms). The job went from 321 s to 142 s, and the solver was now only 13 s of it. Grid set-up (53 s) and the report (74 s), both on the CPU, made up the rest.
Step 2: geometry on the GPU
Building the cut-cell grid means evaluating the car’s signed-distance function at tens of millions of points. LeonSim’s CAD is plain NumPy, so we don’t rewrite it in a shader language: we trace the NumPy code into WGSL and evaluate it on the device. The traced car matches NumPy to 1e-5 m near the surface and gives the same solid cells (S27.6). Set-up on the H100: 53 s → 2 s.
Step 3: the report’s pictures on the GPU
The report renders the car several times (geometry views, surface pressure, floor pressure) with a z-buffer splatting renderer. In NumPy that took tens of seconds per job. On the device it is two passes: each thread takes one triangle, subdivides it until its samples are less than 0.7 pixels apart, and writes an order-preserving integer encoding of the depth with atomicMax. A second pass lets the sample that holds its pixel’s depth write its colour. The images on this page were drawn that way: 595 k triangles at 3880 px wide in about 2 s, including Python. Report on the H100: 74 s → 18 s.
Step 4: making it repeatable
While checking the new paths we found that identical runs on the Radeon did not give identical forces. That turned out to be a race in the coarsest multigrid level that only AMD hardware exposed. Fixing it made every GPU we have bit-for-bit reproducible. All eight checks of the GPU test suite now pass on all six NVIDIA GPUs, on the Radeon 680M and on the llvmpipe software driver.
The result
| device | before | drive on GPU | everything on GPU | set-up / solver / report | cost per job |
|---|---|---|---|---|---|
| L40S | 384 s | 152 s | 33 s | 2 / 12 / 17 s | $0.024 |
| H100 | 321 s | 142 s | 37 s | 2 / 14 / 18 s | $0.047 |
| A10G | 396 s | 168 s | 50 s | 2 / 29 / 18 s | $0.024 |
| A100 80GB | 362 s | 260 s | 54 s | 3 / 18 / 30 s | $0.047 |
| L4 | 580 s | 241 s | 71 s | 3 / 39 / 27 s | $0.028 |
| T4 | 417 s | 259 s | 78 s | 3 / 47 / 24 s | $0.027 |
| Radeon 680M (mini PC) | 390 s | 206 s | 165 s | 1 / 150 / 13 s | – |
| CPU, native Rust, 16 threads | 702 s | 45 / 594 / 55 s | – |
Costs are Modal list prices on 8 October 2026 (GPU plus 8 CPU cores and 32 GiB). Job time is the container’s task time, including Python start-up.
Three things stand out:
- The L40S is the best buy at this size. It is as fast as the H100 on 2.5 M cells and costs half as much per second. A whole F1 aerodynamic study with its report costs 2.4 cents.
- On the integrated GPU the solver is now everything. Set-up went from 45 s to 1 s and the report from 54 s to 13 s. The 150 s that remain are the GPU iterations.
- The pressure solve is the next lever. On the H100 the multigrid-CG pressure correction is about 80 % of each iteration.
Did the answers change?
Not beyond the noise, and it is worth being precise about the noise. A medium F1 run does not converge to a fixed point; it settles into a 3–5 % oscillation, and the averaged forces depend on where the averaging window falls. Across devices the downforce comes out at one of two values, −CL·A 1.889 or 1.971 m², depending on the last bits of each GPU’s rounding. The CPU’s 1.937 sits between them. Fifty SIMPLE iterations from the same start agree with the CPU to 1e-5, so this spread is the run-to-run uncertainty of a single medium run, not a GPU error. We looked at that uncertainty more closely on the 2026 car.
What is still on the CPU
The matplotlib figures of the report (13–18 s: field slices and convergence plots), the first build of a car imported from STL (its mesh distance table is cached afterwards), Python start-up and the one-off kernel compilation.
Reproduce: modal run bench/modal_gpu_eval.py::evaluate runs the GPU test suite, the speed benchmark, the Ahmed body and the F1 car on each GPU. The full tables, profiles and raw outputs are in results/aero/gpu_eval/.